
Introduction to Variability
Overview: Students develop their own questions about variable sources, and observe variability in terrestrial and astronomical sources, and learn about X-ray binary (XRB) star system as one possible explanation.
Physical resources: None
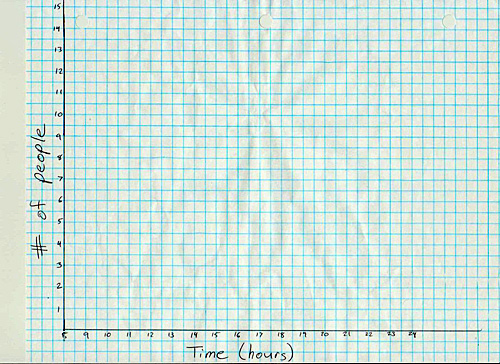
Electronic resources: Movies of blinking car headlights, lighthouse, variable sources in M3, restaurant analogy time data, histogram light curve graph paper (restaurant time histogram)
Opening data to motivate question-asking: examples of light sources with variable flux:
- Blinking car headlights: (From 0:00 to 0:05)
- Movie of variable sources in globular cluster M3: Inconstant Star Cluster
- Students record observations about the objects, and similarities and differences between the objects.
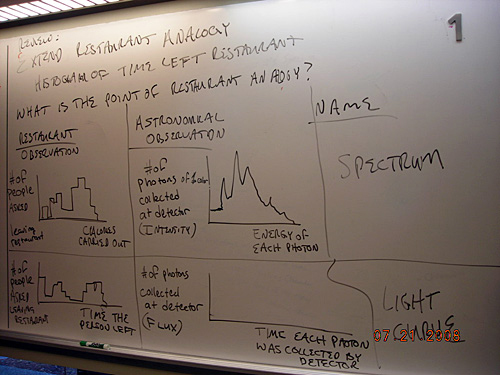
- Extend restaurant analogy to include timing information:
- Describe the relationship between actual spectra and light curves from Chandra and their corresponding elements in the restaurant analogy. Notes from this discussion: (restaurant analogy comparison).
- Students create histograms of the time restaurant patrons leave the restaurant, using bin widths of 30 minutes, 1 hour, 2 hours and 4 hours.
How are the restaurant histograms like spectra and light curves?
- Students then sketch the light curves of the 3 sources they examined earlier: blinking headlights, lighthouse and variable stars in M3.
Development of models
- Task: Generate as many models as possible that could explain why the flux you would receive from a source might change.
- Possible ideas: change distance, change luminosity (by changing temperature or changing size), something absorbs or obscures the object either close to it or close to us (clouds, dust).
- Read about XRB from student-generated "expert project" wiki and from two articles:
- Van den Heuvel, E.P.J. and van Paradijs, J. "X-ray Binaries". Scientific American. November, 1993.
- Black Holes FAQ
- Students record and share the 2 most important things they learned from these articles, recording group consensus on the whiteboard.
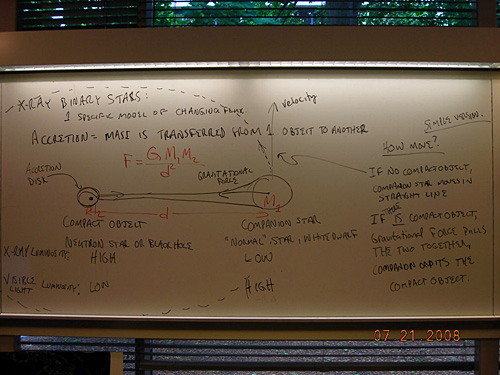
- Instructor develops or share basic picture of XRB system on the board:
- Notes: (XRB mechanics)
Teacher tips/tricks:
- Timing: 3.5 hours in Summer 2008. To save time, spend less time emphasizing differences in histograms with different bin sizes. Recall, this is a review based on their experience making histograms of the calories consumed back in investigation 3. Additionally, the discussion of why flux may change could be held as a full-class discussion, instead of individual group presentations, especially as the students don't apply these models right away. (But they do come back in activity 5.)
- Identifying important ideas from the reading and having groups vote for the most important points with "stars" led quickly to the most important points about XRB systems, which are then pointed out in the lecture.
Assessment ideas:
- Why do some light curves have gaps in them? (daylight)
- What could it mean if all the sources in your field got less bright? (clouds?)
- How would life on a planet around a particular star be affected by its variability?
- Give several light curves and a suggestion for a possible model for each. Some are physically possible and some are not. Identify which models are not possible for a particular light curve. (i.e. a star which changes radius cannot be a valid model for a source with a light curve that goes to zero: a star cannot have zero radius!)