
Defining and Measuring Angular Width, Unit Conversions, Scientific Notation
Overview: Students learn to use the image processing software "SAO ds9", learn to measure angles in radians, unit conversions and scientific notation and get a chance to practice these skills with digital images of objects in the room.
Electronic resources: a common image to measure angular width of different objects in FITS format (angular_sizes.fits) (FITS), ds9 image processing software (Installing ds9).
Physical resources: two sets of cards to measure area, with an integer multiple conversion between them; two sets of straws to measure distance, with an integer conversion between them.
Demonstration: Defining Angular Width
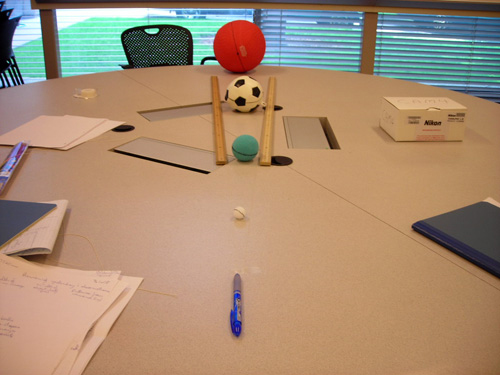
The instructor sets up a situation similar to the students' challenge from the previous activity, having recorded his/her own data as an example. Review the columns of data they took yesterday. Add a third column of "important things": width of object in the image, which was the same for each image. Motivate activity by asking "What was it that was the same?"
- Put strings from camera to edges of objects, each in turn, removing the closer objects, but keeping the strings there. Ask students to notice what is the same in each case: Angle made by the strings. Image showing this relationship: same angular size
- This motivates the definition of angular size: the angle made by the lines connecting each side of the object to the detector. Pixels actually measure angle. More pixels → wider angle. (Could show zoomed in test image to see and count pixels.)
- Challenge: Have each group predict where a new size object should be on the demo setup so it is the same angular width in the image, but without looking through the camera.
- Radian is a measure of angle that is more general than pixels in a particular camera. Show a circle with angles measured in both radians and degrees. 1 radian ~ 60 degrees (The Radian).
- Motivate factor-label conversion: We must learn to convert between different units that both measure the same quantity, angular size.
Factor-label conversion: Converting units
- Each group measures width of an object with one unit of straw. Each group measures again, using different unit of straw.
- Instructor demonstrates conversion process with length measurement to confirm that we could predict the correct answer without actually doing the measurement!
- Students measure area of a surface with a pad of sticky notes, then, using factor-label conversion, predict the area that would be measured with smaller sticky notes. Check prediction by actually measuring with new unit.
Learn to measure angular size with ds9
- Instructor uses common FITS image of several objects at a distance, and demonstrates use of ruler tool and circle region to measure angular size in pixels.
- All students measure angular width from a common image in ds9 of a rectangular object (ruler tool) and circular object (circle tool).
- Give students a conversion factor from pixels to angular size. (Note: our cameras, on 1040 x 820 resolution have 1 pixel = 7.9 x 10⁻⁴ radians = 0.00079 radians).
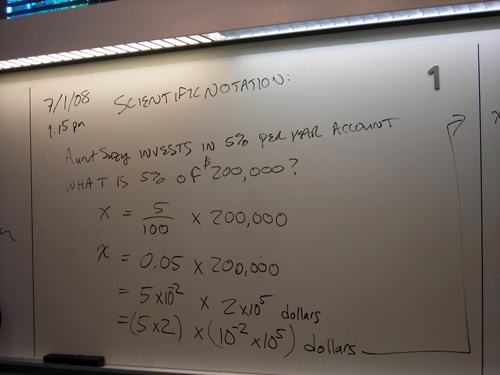
Scientific notation practice: demonstrate with one example, then students do several. See images. Takes about 1 hour.
- Converting large and small numbers back and forth from regular to scientific notation. Notes from this process: scientific notation
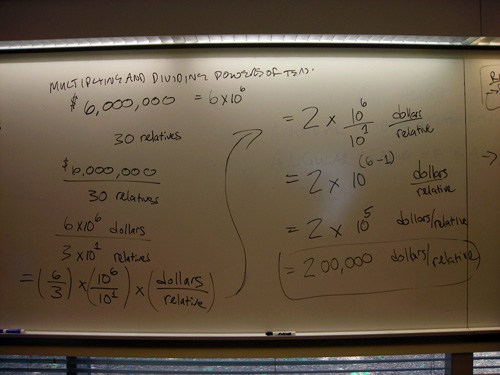
- Multiplying and dividing numbers using scientific notation
- Using factor label conversions with scientific notation (start with just kilometers to meters, then more complex). Notes: factor label example
- Powers of Ten video can be instructive here, to start giving students an idea of scales in the universe and what we mean by negative exponents.
- Instructor demonstrates converting angular width of rectangular object from common image opened by all students from pixels to radians.
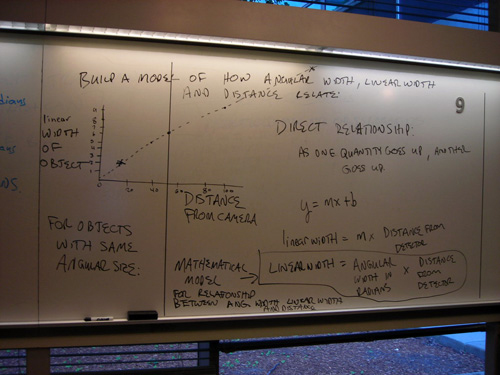
Summary of relationship between angular and linear width:
- Instructor introduces patterns, including the plot from yesterday, and has a student explain it in words. Recast this relationship in algebraic form: linear width = angular width * distance to detector. Notes: angular size math; in line
- Instructor draws parallel between y = mx + b and linear width = angular width * distance. Slope is constant in math relationship, and linear size was constant in the physical observations.
- Students predict (from graph and from equation, if time) where an object of a certain size would need to be placed to have the same angular size in the image.
- Instructor introduces "Solving Problems in Science" technique/worksheet, and gives students example of its use to predict the linear size of one of the objects in the common image, helping them to apply the factor-label conversion and scientific notation skills learned earlier. (This last step could be added to the start of Activity 4, if required by time.)
Teacher tips/tricks:
- Timing: These activities can take about 3 to 3.5 hours, depending on how much practice time is needed.
- Alternatives: If time, students can make additional observations about the relationship between angular width, linear width and distance, before the introduction of the mathematical model.
- Students measure angular size of their 3 images, and converts each to radians, adding them to their data table. (Should be approximately the same.)
Or
- Challenge: Investigate the relationship between linear size, distance and angular size:
- Instructor explains that based on chart, angular size was held constant, we changed linear size and watched what happened to distance.
- Divide groups. One half hold linear size constant, change distance and watch what happens to angular size. Other half hold distance constant, change linear size and watch what happens to angular size.
- Predict what each of the representations of data will look like (chart, plot, images and paragraph), then students set up the situations and take those images, and get practice measuring the angular size of objects on their own. They make charts and graphs and compare the results of this testing experiment to their predictions.
Assessment:
- To make a connection to a physical situation, have students use the graph and/or equation of linear size vs. distance (for constant angular size) to predict where they would place a new object, as they had done in the first part of this activity.