
Measuring Color
Overview: Students learn that filters allow only certain colors / energies of light through, and that our experience of colors comes from combining 3 fundamental colors (RGB) in either our eyes or through 3 separate filtered images.
Physical resources: colored construction paper, exit sign, diffraction grating, overhead projector, colored pencils/crayons.
Electronic resources: Sunflower filtered images (Flower1.fits (FITS), Flower2.fits (FITS), Flower3.fits (FITS), Orion filtered images from MicroObservatory (MO_orion_red.fits (FITS), MO_orion_green.fits (FITS), MO_orion_blue.fits (FITS), Orion filtered images from Hubble Space Telescope (m42r.fits (FITS), m42g.fits (FITS), m42b.fits (FITS ), Open cluster NGC 7789 filtered images from MicroObservatory (NGC7789_redshifted.fits (FITS), NGC7789_greenshifted.fits (FITS), NGC7789_blueshifted.fits (FITS), Observation/prediction blank tables (three color observations table, three color predictions table).
Developing model of color and filters:
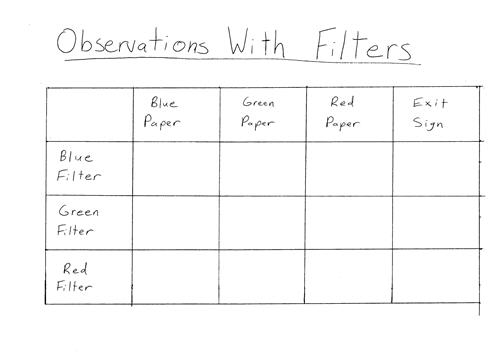
- Filters: Students record observations of a red illuminated exit sign and different colored pieces of construction paper through red, green and blue filters. They describe results using "high flux" and "low flux". Could organize according to a chart: filters down the side, and objects across the top, filling in rows with "low flux" or "high flux." Empty example chart: (filter observation table)
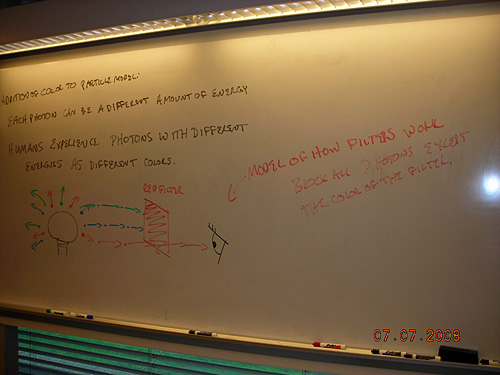
- Instructor introduces an addition to the particle model of light to explain these observations: Each photon can be a different amount of energy. Humans experience photons with different energies as different colors.
- Instructor builds a model of how filters work, using the particle model of light, and based on the observations of students. Notes: (how filters work) Color is our experience of the energy of the different photons. They only allow through a range of energies (colors).
Applying model of color and filters:
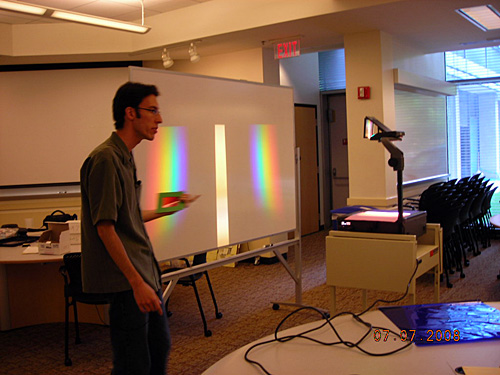
- Instructor introduces diffraction grating, put over an overhead projector, with slit on overhead. Example setup: (overhead diffraction) Observe how it splits light into a spectrum.
- Prediction 1: Ask students to predict (by drawing with colored pencils) what the spectrum will look like if a red filter covers the diffraction grating.
- Test prediction 1: When done with predictions, observe what happens when you test this, have them draw this observation (results of the testing experiment), and then write about what was the same and different between their predictions and the results of the experiment. Discuss with their small group.
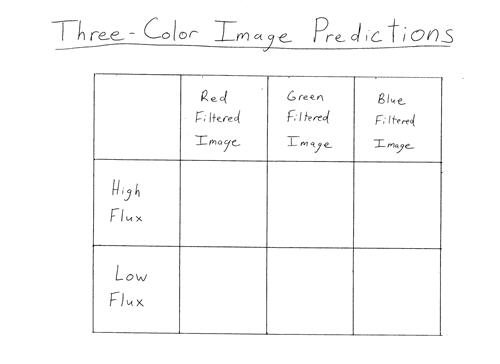
- Prediction 2: Show full color image of sunflower. If the sunflower was photographed with a filter in front of the detector, make a chart of predictions of what objects you'd expect to show up with high flux or low flux in an image taken behind each color filter. Instructor can show example by filling in chart for first filtered image. Empty example chart: (three color predictions table)
- Test prediction 2: Instructor presents students with unlabeled images, and students use predictions to match which image was taken behind which filter.
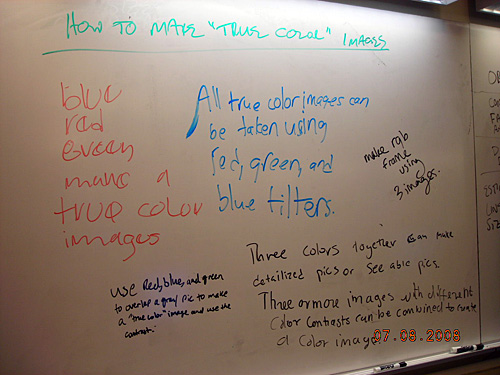
Creating and interpreting true color images of sunflower and Orion nebula:
- Instructor (or multiple instructors in small groups) show students how to combine the filtered images of sunflower (Red-filtered: Flower2.fits (FITS), Green-filtered: Flower3.fits (FITS), Blue-filtered: (Flower1.fits) (FITS) to create a true color image (Process: creating a true color image by opening RGB frame.)
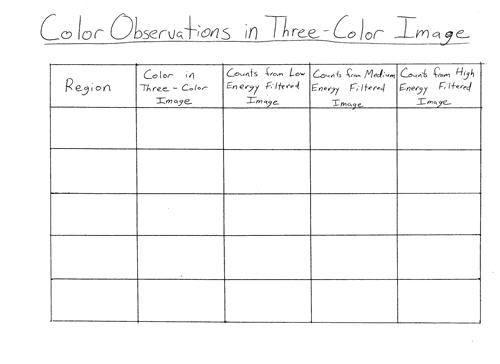
- Students select 2-3 regions of true color sunflower image, each with a distinctive color (i.e. mostly red or blue), and use these regions to examine the individual filtered images and create a chart of observations of the number of counts in that region for each filtered image. Empty example chart: (three color observations table)
- Instructor wraps up discussion of color, using these observations (which show, for example, a blue region has higher flux in the blue filtered image, than any other image) and color combination demonstration (shining colored lights of different intensity on the same screen) to explain that we experience different colors because of a combination of these three.
- Students create a true color image of the Orion nebula, with red-, green- and blue-filtered images taken by the Hubble Space telescope
- Orion filtered images from Hubble Space Telescope: Red-filtered: m42r.fits (FITS) Green-filtered: m42g.fits (FITS), Blue-filtered: m42b.fits (FITS)
- Students create a similar chart to the one for the sunflower above, choosing 2-3 regions with different color in the true color image, and recording the number of counts in those regions from each of the filtered images. Again, they should notice that a region with a pronounced color shows more counts (or photons collected) in the filtered image where only that color light is allowed to pass (i.e. in a green region, the highest number of counts are in the green-filtered image.)
- Alternative target: Open cluster NGC 7789 filtered images from MicroObservatory (NGC7789_redshifted.fits (FITS), NGC7789_greenshifted.fits (FITS), NGC7789_blueshifted.fits (FITS) Stars in this cluster can easily show different colors, especially if the blue image contrast is boosted
Teacher tips/tricks:
- Timing: About 2 hours, but time can be cut by only working with prediction 2 (which is more relevant to true color images which students will use heavily later on.)
- (filter reflections): Example of student-generated list of things they felt they learned from observations of color and filters, as put up at end of day for a review.
- (true color reflections): Example of student-generated list of things they felt they learned about making true color images, as put up at end of day for a review.
- Working with small groups, as opposed to one large group, works best to show students the processing steps involved in making a true color image.
- If more emphasis on representing observations in a variety of ways is desired, student spokespeople could present the observations of the sunflower and/or Orion regions as a plot (counts vs. color in a bar chart), chart, image and written paragraph, and then use all those representations to present their results.
- Difficulties with "true color" images:
- Although a true color image can represent what we'd see with our eyes, astronomers can still change the bias and contrast of the image, to emphasize different features of the image, just as with the images made in activity 2.
- When making true color images, students should start by locking the colorbars together on the RGB dialog box. This means the bias and contrast of each color changes together, when one is adjusted. However, the colorbars are "stretched" over different ranges of counts in each image, so there is no "correct setting" for a "true color" image. Indeed, students can see this if they compare their Orion images to each other.
- The important distinction to be made (in activity 6) is the difference between what color represents in true color (energy) vs. false color (intensity) images, so for now, let students experiment with making their "true color" images look different.
Assessment ideas:
- Pete is a CAI participant. When asked "What does a filter do?" here's what Pete said: "When you look through a red filter at things around a room (people, lights, or whatever), everything is colored shades of red. That means the filter must make any light that is coming through it turn red." Would you agree or disagree with Pete's statement? Use observations you have made to give an explanation for your answer.
- Predict what the spectrum projected through the diffraction grating would look like if it was covered by a blue filter. Draw with colored pencils.