
Introduction to Image Processing
Information in images (counts in pixels) vs. how they are displayed (contrast/bias)
Overview: Students learn how images are displayed in order to gather the maximum information from them using contrast and bias settings. Students apply color tables to create a false color image.
Electronic resources: MOBS Prudential Center image (PrudentialCenterMicoObs.fits) (FITS), (prudential1, prudential2, prudential3, orion1, orion2, orion3, Orion image (orionChallenge.fits) (FITS), Challenge images (to be reproduced): Orion (PDF), prudential (PDF)
Discuss: How do we measure the amount of light collected by a detector?
- Relate "counts" which are the value of each pixel to the particle model of light. Each photon collected is turned into a certain number of electrons which are counted by electronics. More photons → more counts. Demonstrate with an image in ds9.
- Note: Whenever we measure light, we are really measuring what our instrument "packages", so we have to understand how it works to turn that measurement back into a real physical quantity. (Noise comes from packaging effects...)
Demonstrate in small groups:
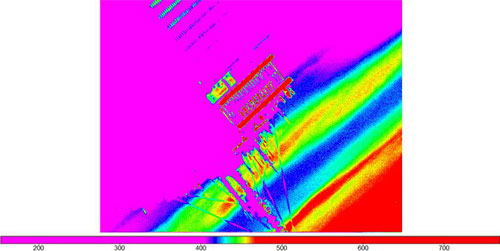
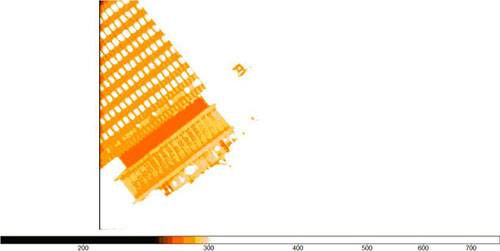
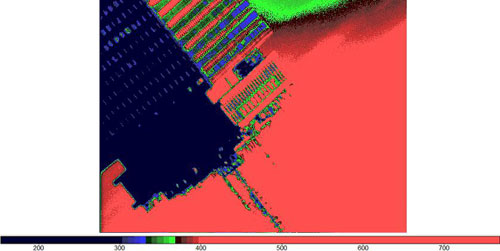
- In ds9, show how to use the contrast (right click or control click (Mac) and move up and down), bias (right click or control click (Mac) and move left and right), color tables ("Color" from toolbar) and changes in scale ("Scale" from toolbar) to alter how an image is displayed.
- For each tool: Instructor demonstrates on a terrestrial image (Prudential tower image), then students repeat analysis.
- Instructor then gives a challenge to have students make the image look like a new example, without being shown how to do it. Each new example should highlight an important feature of the object that is not immediately obvious when first opened. In other words, changing how an image is displayed allows us to see or highlight different features of the image.
- Possible challenge images: prudential1, prudential2, prudential3
- "Key" to image processing settings to create these images: prudential (PDF)
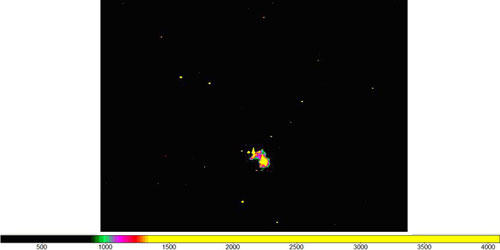
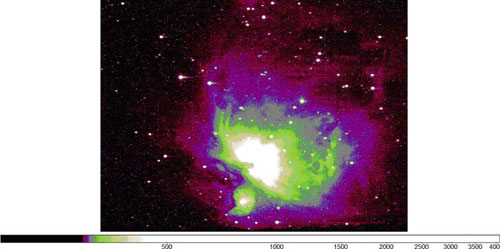
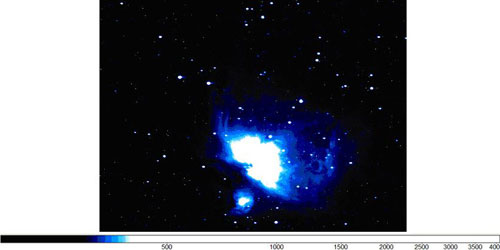
- Continue this process with an astronomical image (Orion nebula), giving the students 3 different challenges to point out three different features.
- Possible challenge images: orion1, orion2, orion3
- "Key" to image processing settings to create these images: orion (PDF). For each case of image processing settings, have the students check the highest and lowest brightness pixel. They will always be the same, because image processing does not change the count values, just how they are displayed.
Wrap up discussion: How does adding color help us see brightness (flux) differences better? Give an example.
Teacher tips/tricks:
- Timing: This can take as little as 30 minutes.
- Having multiple instructors show small groups how to use the tools is most effective, including giving them the "processing challenges" to reproduce.
- To save time, we also tried showing two groups at once how to do a step, then let students try it out themselves, while instructors went around helping anyone who was really stuck.
Assessment ideas:
- Have students explicitly write out their response to the above wrap up question.
- Students should predict what tools were used to make changes between two example displays of the same image. (See example images).