
Modeling Why Objects Produce Light
Physical resources: Fluorescent light bulb, incandescent light bulb, variable power supply, restaurant histogram data, graph paper.
Electronic resources: "Atoms in Motion" simulation.
Overview: Students observe light sources, and question why the light is produced. A simple model of "bouncing" (accelerating) charged particles producing photons is presented. Students build a histogram in preparation for further study of spectra.
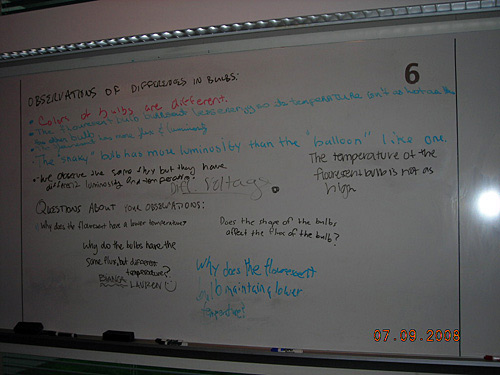
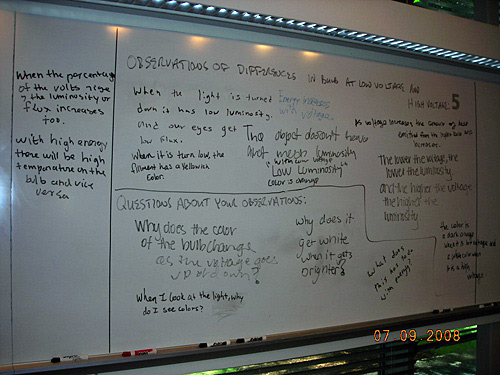
Observations of why sources of light are different:
- Students observe two stations, and ask questions about what is different about the objects:
- Station 1: A fluorescent and incandescent bulb of same light output power. Student observations: (fluorescent incandescent)
- Station 2: An incandescent lightbulb on a variable power supply, set at low and high voltage (low and high temperature). Student observations: (high/low voltage)
- Students should be encouraged to use the words they've learned in investigation 2 (flux, luminosity, color, energy) to describe the differences.
- Questions / discussion should be guided to identify that some things that give off light are hot and some things are not hot.
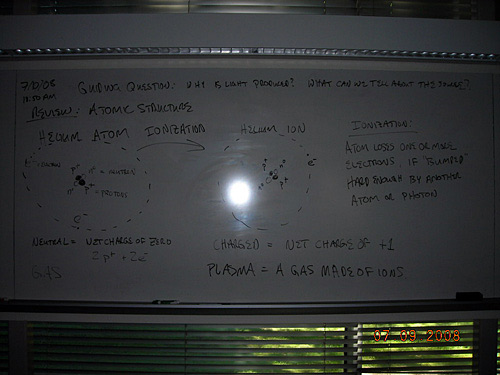
- Resulting guiding questions for this investigation are: Why is light produced? What can we tell about the source of light from the kind of light it produces?
- Possible student questions/ideas:
- Why would you expect stars to give off light in the first place?
- What are properties of the sun and other stars that you can determine by looking at its color?
- Things that are hot give off energy as light. Where does that energy come from?
Atomic structure lesson:
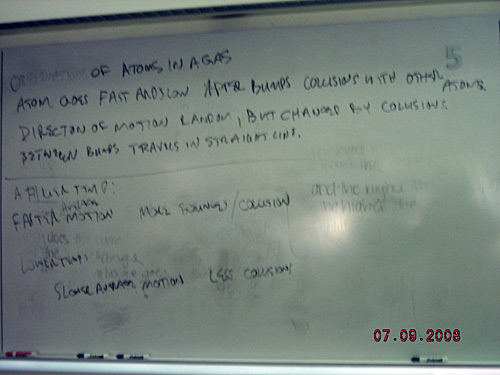
- As a demonstration, using "Atoms in Motion", have students investigate the motion of particles in a gas, and how that is affected by changing the temperature.
- Use default simulation file ("air" simulation), but turn off the velocity histogram.
- Prompt: Watch one atom, and describe in a sentence what happens to it.
- Then, increase the temperature, watch one atom and describe in a sentence what happens to it.
- Then, decrease the temperature, watch one atom, and describe what happens to it.
- Students must write a description of how changing temperature affects the motion of the particles.
- Possible descriptions / observations:
- All atoms not moving at the same speed.
- One atom does not always move at the same speed.
- Higher temperature → move faster, so atoms bump harder and more often.
- But there are still some that are moving slowly!
- Summary of student observations: (Atoms in Motion observation)
- Instructor introduces atomic model and extension to plasma: An atom is a positive nucleus surrounded by negative electrons. Atoms can lose or gain electrons to become ions, if they bump into each other hard enough (i.e. if hot enough). A gas of ions is called plasma, and many astronomical sources are plasma, so that will be our assumption.
- Notes: (atomic model)
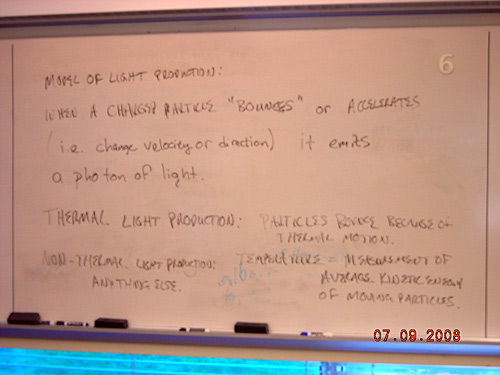
- Instructor introduces model of production of light: when charged particles "bounce" or "accelerate" (i.e. change velocity and/or direction), they emit a photon of light.
- Notes on thermal/non-thermal light production: (light production)
- Thermal production: Example of how a hot thing glows: each bump produces a photon.
- Example of non-thermal light production: show animation of electrons spiraling around magnetic field (E/M apparatus to show effect of magnetic fields?) (How Radio Waves Are Produced) (About 2/3 of the way down the page)
Building a histogram: The restaurant example
- Introduce restaurant histogram example: We are not allowed to go inside the restaurant or look around, but we ask each person who comes out how many calories they ate (i.e. the amount of energy they are carrying). Depending on what kind of restaurant it is, we will see differences in what comes out.
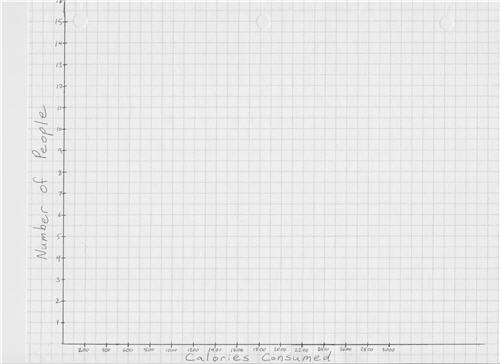
- Instructor builds example with a subset of data points, choosing reasonable bin size, based on spread of data. Students complete the histogram.
- Histogram data file (PDF)
- Image of empty histogram plot, with correct size axes (restaurant energy histogram)
- Students then create histogram with bin sizes of 100, 200, 400, 800, 1600
- Discuss: what is good/bad about each of these?
Teacher tips/tricks:
- Timing: About a half hour for the observations, half hour for the lecture, and one hour for building the histograms
- Additional / alternative stations:
- Video of blackbody changing temperature or hotplate / electric heating element on camp stove
- Two stars of different color (Constellation of Orion showing Rigel and Betelgeuse)
- Other objects that are not hot, but still produce light: fluorescent minerals?
Assessment:
- Predict what the histogram of a health food restaurant would look like. Predict what the histogram from a fast food restaurant would look like.
- One student says "Things at higher temperatures have atoms that move faster." Would you agree or disagree? Why? (Remember, some atoms still move slowly, there is a range of speeds with which they move and bounce!)