
Analysis of Different Parts of Cas A
Overview: Students select several regions of Cas A, based on their color from a true color image, and compare and contrast the composition of each of these regions, using logarithmic plots of the spectra extracted from those regions.
Physical resources: None
Electronic resources: files with typical elemental emission lines, from Tracey, and list of corresponding elements, as a text file
Logarithmic Plots:
- Extract overall spectrum of Cas A.
- Estimate number of peaks, and intensity at energies of 2 keV, 4keV and 6 keV, record publicly, in a chart similar to the following: (elements table).
- Instructor explains how to read and interpret a logarithmic graph.
- With logarithmic graph, estimate number of peaks, intensity at 2 keV, 4 keV and 6 keV, record publicly.
- Discuss the smaller spread in the values of intensity at high energy, when reading the plot: i.e. the logarithmic scale stretches out low values and squeezes together high values, so details at all levels can be seen well.
Identification of spectral lines:
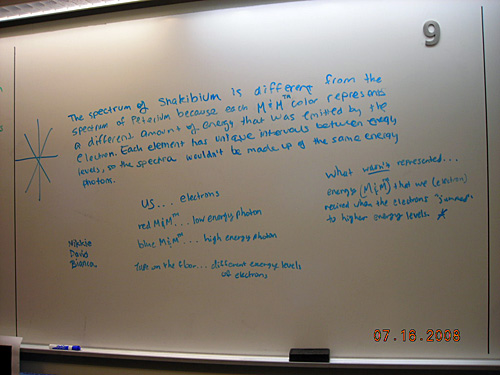
- Students extract spectrum, and learn to overplot the energies where particular elements produce photons because of their characteristic electron transitions between energy levels. Process: plotting more than one data file on a plot.
- Focus question: "Why would we expect to find these particular elements in a supernova remnant?" (The elements present in the supernova ejecta come from two processes 1. regular fusion in core of star during normal lifetime, for atoms lighter than iron and 2. more exotic fusion during supernova explosion, for atoms heavier than iron.)
- Students in summer 2008 developed 2 models of why these elements would be present: 1. elements created in the star, 2. elements were in surrounding material before explosion, and are just getting "excited" now, so emit light.
Introduction of MEKAL model for fitting spectra with emission lines, and thermal bremmstrahlung model:
- Instructor discuss the MEKAL model: used for fitting a hot, transparent, diffuse gas with emission lines, named after the developers of the model, Mewe-Kaastra-Liedahl in 1995.
- Includes thermal bremmstrahlung (a plasma of electrons and ions which can freely "bounce" off each other) to explain where the photons between the peaks of the MEKAL model come from.
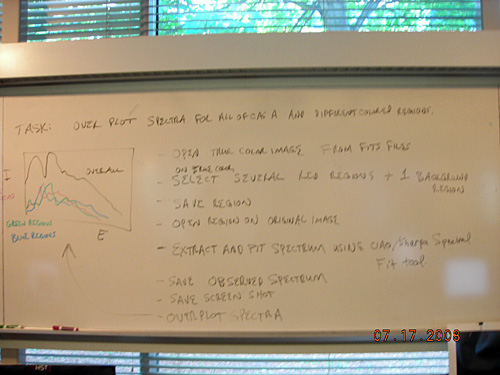
- Student challenge: select 3 different regions in the true color X-ray image made in activity 2, extract the spectrum, fit each observation with a MEKAL model, and plot all spectra on the same plot, with different colors, to compare.
- Note: students should choose a "featureless" part of the SNR for their background region, one with no bright knots, but still inside the SNR. Process: choosing a background region
- When students put different regions' spectra on the same plot, have them choose "View...Step" to change the plot style to a histogram, and then "Color...Step...Red" or "Green" or "Blue" to change the line color to indicate the region for which they've extracted a spectrum (see example of student work below) Process: plotting more than one data file on a plot.
- Example of challenge statement: (cas a peer challenge)
- Wrap up discussion: What is different about these different regions? (different heights of peaks could indicate more or less of a particular element.)
Teacher tips/tricks:
- Timing: Can take up to 3.5 hours. To cut time short, have each group investigate only one region, and then share data to overplot. In this way, all student overplots of the 3 regions will be identical.
- Discussion of two models for SNR elements is a great example of the kind of connecting observations to models that we intend students to have, which will help them develop their own investigation projects.
- Note there are two files for overplotting locations of lines, one in eV, one in keV.
- Selecting background regions is an art: featureless regions inside the SNR will enable students to "subtract out" the overall spectrum of Cas A, which gets reflected from nearly every part of the remnant, so they can see individual differences between the different regions. See the example background region (dotted circle) in the student work file above
Assessment ideas:
- What might it mean that some peaks are taller than others (more of that element is present)?
- Say you had 3 spectra from 3 regions, chosen by their color in a true-color X-ray image, but forgot to color code them when you plotted them all on the same screen. How could you tell which observed spectrum came from which region, without the color coding on the spectrum observations? Examples of student responses: (how tell color 1, how tell color2).
- Where does the continuum spectrum underneath the atomic lines come from? (i.e. there are still free electrons which bounce around and give all energies).
- One student says "I predict the SNR has all elements present on our list of lines, because there is at least some intensity at each of these energies, even if it does not look like a "peak". Do you agree or disagree? Examples of student responses: (all elements response 1, all elements response 2). Note: at this point, students hadn't talked in detail about thermal bremmstrahlung, as the reason for the underlying spectrum, so many (incorrectly) agreed with this statement. However, this was a very nice way to motivate talking about the process of thermal bremmstrahlung. See video mentioned above.
- Show a spectrum with several lines: does this indicate there must be at least one element present, or more than one? (at least one, but not necessarily more than one, because one element can have several emission lines...)
- Make a prediction of a graph of angular size vs. time of a SNR. (or choose one from a list) What does that mean is happening to the SNR? (slowing down vs. keep going at steady pace, vs. speeding up!)