
Spatial Resolution (Proper Motion)
Overview: Students experience their spatial resolution limit by trying to read newspaper text from different distances.
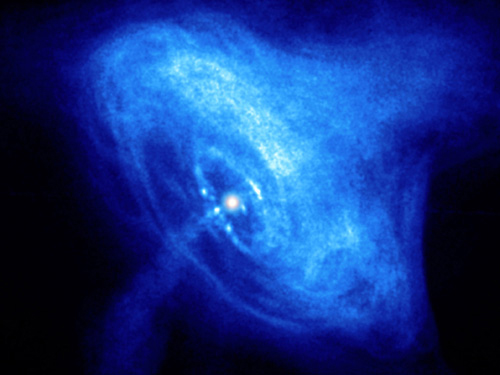
Electronic resources: RR Lyrae FITS image, RR_LYR.fits (FITS), images of Crab Nebula from Einstein (crab nebula einstein) and Chandra (crab nebula Chandra)
Physical resources: newspaper, meter sticks.
Students predict linear size of nearby stars:
- Give distances to nearest stars, measure angular size of stars, then predict how big they are (Can use RR Lyrae image from MicroObservatory, typically 5-10 pixels in angular diameter.)
- Intro size scales, and conversion factors (m -> solar radii) and give practice with powers of 10 to talk about how big the star prediction would be compared to size of sun (for 8 pixels, about 106 times larger) or to size of solar system (about 1000 times as big.)
- Result is huge compared to the sun!! Is this correct? Solicit ideas…
Students experience that their eyes cannot distinguish objects that are smaller than a certain angular size.
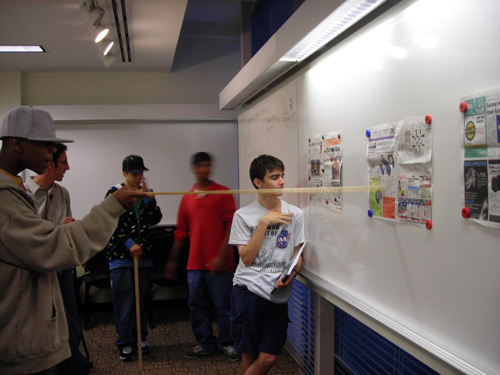
- Post a sheet of the day's newspaper for each group to try and read, starting at a large distance (several meters away).
- Student will try to read the paper from far away, with partner close for double checking. Image of task setup: newspaper resolution
- Students stop where they can reliably read the newspaper.
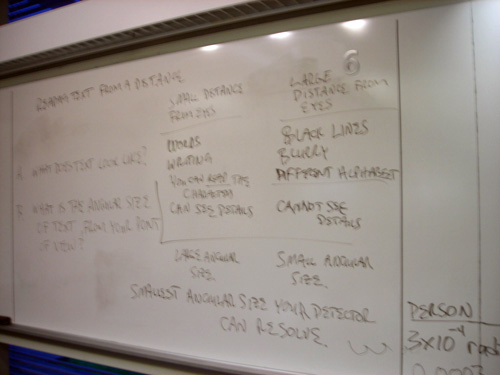
- Students share their observations in a public chart. What does the text look like when you're closer vs. further? What happens to the angular size of the text when you're closer vs. further? Notes: resolution descriptions
- Students calculate their own minimum angular size resolved, and compare this data across the class, in multiple ways (chart, graph, written, image). Chart with columns of linear height of text, distance from detector (eye) and angular size of text when it can first be read reliably. Rows are different individuals.
- Discuss: Why does this happen? The way optics work, they spread out light into a particular shape. The size of that shape is related to the minimum angular size resolved by the telescope. Any sources that have an angular size of that amount or smaller get smeared out, and we cannot resolve any details in that image.
- Things that are completely smeared out are called point sources. All stars will be point sources.
- If objects are larger than the minimum angular size resolved, they are called extended sources.
Connection to astronomical images:
- Telescopes have a smaller minimum angular size detected (better resolution) than the human eye. Give values for comparison:
- Human eye: smallest angle resolved ~ 3 x 10⁻⁴ radians
- MicroObservatory: FWHM ~3 pixels = 15 arcseconds = 7 x 10⁻⁵ radians
- Chandra: FWHM ~2 pixels = 1 arcsecond = 5 x 10⁻⁶ radians
- Example: Show images from Einstein and Chandra showing different resolution of the Crab nebula. Can zoom in to see that resolution has nothing to do with angular size of the image—if it's a blob, it will just be a big blob.
Teacher tips/tricks:
- Timing: A shorter version can be used (1 hour total) if the predictions of stellar sizes are just demonstrated, and calculations of individuals' minimum angular size resolved are dropped. Patterns in the public data table can be enough to motivate the connection to astronomical images.
Assessment:
- If the average minimum angle is 1 arcminute, and those people are standing an average distance from the newspaper, would the minimum angle resolved be smaller or larger for people standing closer than average to their newspaper? How about the people standing further than average? Could then calculate their result, if time.
- If you were on an airplane, could you read the time on the clock tower in downtown Boston? Could MicroObservatory? Could Chandra? (Predict angular size at that distance, then compare to minimum angular size detected by eyes, MicroObservatory, Chandra)