
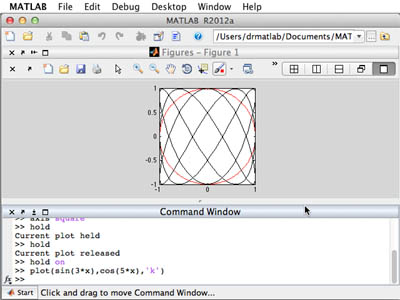
MATLAB can graph both functions and non-functions, as demonstrated by the circle and Lissajous curves.
In the previous unit, plotting was introduced with Newton's method, but it is worthwhile to further explore the capabilities of plotting in MATLAB®. Preliminary exercises will encourage you to discover how to stylize your plots as well as plot multiple functions with the same plot command. To do this, you will be asked to plot different basins of attraction, sets of points that converge to a given root, for Newton's method. We will generalize Newton's method to higher dimensions by writing the function as a vector and finding the Jacobian matrix, which represents the linear approximation of the function. To visualize the basin of attraction, we will color a grid of points according to each point's resultant root after iterating with Newton's method.
Related Video
The video below demonstrates, step-by-step, how to work with MATLAB in relevance to the topics covered in this unit.