
As is described in the section on sound, the sound that we hear doesn't correspond linearly to the amount of electric power used; it instead corresponds logarithmically. A volume control knob must, therefore, have a non-linear change in resistance as well. We graphed the resistance of the potentiometer for every 5 degrees of rotation of the knob in order to measure this effect. To measure the resistance across the potentiometer, we connected a digital multimeter, set to 20 ohms (the maximum resistance of the resistor), to its center lead and to one of its two side leads. We then used a protractor to move the knob in 5 degree increments, noting the resistance every 5 degrees. This is the graph resulting from that measurement:
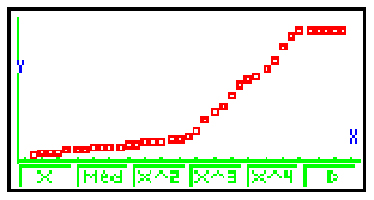
Potentiometer graph of resistance vs. position.
Here is the data used to form that graph:
| RESISTANCE (Kω) | ANGLE (DEGREES) |
|---|---|
| 97.5 | 225 |
| 97.5 | 220 |
| 97.5 | 215 |
| 97.6 | 210 |
| 97.4 | 205 |
| 97.2 | 200 |
| 93.5 | 195 |
| 84.5 | 190 |
| 74.5 | 185 |
| 67.8 | 180 |
| 62 | 175 |
| 60.6 | 170 |
| 55.9 | 165 |
| 48.3 | 160 |
| 40.8 | 155 |
| 35.8 | 150 |
| 30.1 | 145 |
| 21.5 | 140 |
| 17.7 | 135 |
| 16.4 | 130 |
| 15.7 | 125 |
| 14.7 | 120 |
| 13.9 | 115 |
| 13.4 | 110 |
| 12.6 | 105 |
| 11.9 | 100 |
| 11 | 95 |
| 10.5 | 90 |
| 10.1 | 85 |
| 9.8 | 80 |
| 9 | 75 |
| 8.4 | 70 |
| 7.8 | 65 |
| 6.9 | 60 |
| 6.5 | 55 |
| 5.8 | 50 |
| 5.2 | 45 |