
Instructor Insights pages are part of the OCW Educator initiative, which seeks to enhance the value of OCW for educators.
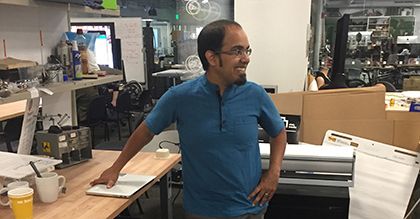
Rahul Bhargava in the MIT Media Lab.
Below, Rahul Bhargava describes various aspects of how he teaches CMS.631 Data Storytelling Studio: Climate Change.
Student Insights
Making the data ‘alive’ through non-quantitative means makes the concept much more relatable and personable. The audience understands this at an organic level, and they are drawn to learning more. It's much more engaging. Long story short, it is much more memorable. And in many cases, that's the entire point.
— Felipe Lozano-Landinez, Undergraduate
Below, students in the course describe the data storytelling techniques they found particularly compelling, offer advice to future students, and share tips with educators interested in facilitating a similar learning experience.
Curriculum Information
Prerequisites
None
The course is open to all technical levels and backgrounds. Students with a strong background in one or more of the following areas are prioritized: journalism, software development, data analysis, documentary, and visual and performing arts.
Requirements Satisfied
GIR ![]()
HASS ![]()
Offered
Every spring semester
The Classroom
 Room 1 of 1
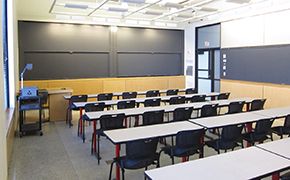
Studio
Studio sessions were held in a classroom with moveable tables and chairs, sliding chalkboards, and an AV system.
Assessment
Grade Breakdown
The students' grades were based on the following activities:
 20% Participation, peer-assistance and paper reviews 20% Participation, peer-assistance and paper reviews 15% Assignments 15% Assignments 45% Technique sketches 45% Technique sketches 20% Final project 20% Final project |
Student Information
Breakdown by Year
Both undergraduates and graduate students
Breakdown by Major
Computer science, business, biology, mechanical engineering, writing, and the arts
Enrollment Cap
Enrollment is capped at 30 so that the instructor has adequate time to support each student as they experiment with data storytelling techniques.
During an average week, students were expected to spend 12 hours on the course, roughly divided as follows:
In Class
- Met 2 times per week for 1.5 hours per session; 27 sessions total.
- Class sessions involved hands-on activities, teamwork, and critique sessions.
Out of Class
- Students completed assignments and readings, contributed to the class blog, and worked on their final projects outside of class.
Semester Breakdown
| WEEK | M | T | W | Th | F |
|---|---|---|---|---|---|
| 1 |  |  |  | | |
| 2 | | | | | |
| 3 | | | | | |
| 4 | | | | | |
| 5 | | | |  | |
| 6 | | | | | |
| 7 | | | | | |
| 8 | | | | | |
| 9 | | | |  | |
| 10 | | | | | |
| 11 | | | | | |
| 12 | | | | | |
| 13 | | | | | |
| 14 | | | | | |
| 15 | | | |  | |
| 16 | | | | | |
 No classes throughout MIT Class meeting Student presentations
 No class session scheduled Critique sessions
 Open work time