
Overview
This page describes several applets and on-line tutorials that cover some of the material presented in the first few weeks of the course. They are organized below according to lecture topic. All of the applets come from four main sites, listed here along with a general note about each. If you are aware of other Web-based resources for learning this material, please let us know so that we can add them.
JHU Signals, Systems & Control Demonstrations - Has many different tutorials and applets available. In general the applets on this site are the best of those listed. If you are limited on time, go to this site.
J-DSP - A very broad application where the user defines what signal processing is done through the setting up of a block diagram. Takes a little time initially to become familiar with the application, but can be very useful. A detailed description follows in its own section below.
RPI Links - Has a lot of applets, but most are not related to the early part of this course. Look to this site later for help on probability, which we plan to cover in a later handout.
MIT's Linear Algebra 18.06
Data Acquisition
JHU Sampling - An ok applet that shows the results of changing the sampling frequency on the sampled signal and also the frequency magnitude.
JHU Discrete-Time Frequency - A quick overview of the differences between continuous and discrete time frequency components.
Digital Filtering: LTI properties, Convolution, FIR, IIR filters
JHU LTI Systems and Convolution - An interactive lecture that contains a very good overview of LTI system properties and convolution. Includes an applet that allows the user to view the flip and shift method of continuous time convolution.
JHU Discrete-Time Convolution - Discrete Time convolution applet that is easy to use and shows the flip and shift method. Not a lot of explanation provided.
J-DSP - See below.
DTFT and DFT: FFT, Overlap-Add, Overlap-Save
JHU Discrete-Time Fourier Series - Discrete Time Fourier Series (DTFS): applet that shows the relationship of DTFS coefficients, which are closely related to the DFT.
JHU Continuous Fourier Transform - Continuous Time Fourier Transform (CTFT): Gives some properties of the CTFT, and allows the user to view the changes to the magnitude and phase of the transform given a change in amplitude, time shift, or derivative of the original signal.
J-DSP - See below.
Spectral Analysis
Interactive demonstration of spectral analysis developed for this course and used in Week 2 of Lab 1.
J-DSP
Java Digital Signal Processing (J-DSP) is an on-line DSP simulator. The program is very broad and does not target a specific topic like the other tutorials. But it can be very useful for filter design, FFT evaluation, and even speech analysis. J-DSP does take a little bit of time to get used to, however.
Filter Example
For a quick example we can design an FIR or IIR filter. The figure below is the main screen of the J-DSP editor, refer to it while reading the example below.
The first step is to skim over the General Information tutorial found under the exercises heading on the main page. This exercise goes through the same example as below and explains in more detail how to attach and manipulate blocks, etc.
- At the main page click on "start J-DSP" under the "J-DSP Main" header to get started.
- First we need an input signal. To do this, simply click on [Sig. Gen] on the left side of the page and then click on the white area to place a sig. gen. block. Clicking on this box will bring up another window where you can define a sequence or select a standard sequence such as a sine or exponential.
- Next we place a filter block on the white area and connect our input signal to it with an arrow. Note that we have not defined any part of the filter, and for now it is just passing the input signal through. To adjust our filter we need to change coefficients.
- Add a coeff. Block to the work area and attach it to the filter block as shown. Clicking on the coeff. block will bring up another window where the a and b coefficients can be entered to define an FIR or IIR filter.
- The Freq-Resp. block attached to the filter block shows the magnitude and phase of the filter. Click on this block and keep the resulting window open as you adjust the coefficients. You can then watch how the magnitude and phase change while changing the coefficients. Remember to press update when you change the coeff. block, then J-DSP will update all blocks simultaneously.
- By adding a plot block to the output of our filter we can view the output sequence. Clicking on the plot block brings up a window where the filtered signal is plotted.
The three blocks at the bottom of the figure are a quick way to view the FFT of a given signal. Simply clicking on the plot block will allow the user to view the magnitude and phase of the fft.
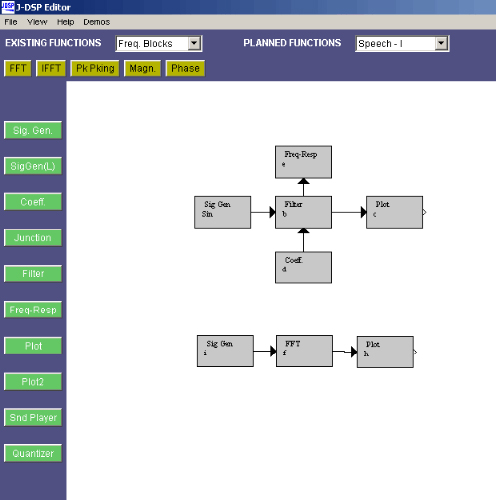
Magnitude and phase of the FFT in a J-DSP Editor. (Courtesy of Prof. Andreas Spanias and J-DSP. Used with permission.)